Jerry - The Jr Research AIde
Challenge
Research in various fields struggles with messy data, participant management challenges, and the hassle of handling resources across different platforms. The current tools lack simplicity and integration, slowing down the research process.
That's where Jerry The Junior Research AIde comes in. By offering a straightforward platform that merges research materials, optimizes participant coordination, and promotes teamwork, Jerry aims to revolutionize research management, making it a breeze for everyone involved.
Follow along for the process part, or skip right to Wireframes and Userflows.
Project Type
UX/UI Design - Enterprise Application
Tech stack
Figma, Notion, FigJam, Material Design 3
My Role
UX Designer and Researcher (in a team of 2)
Stakeholder / Client
Personal Project
Jerry's Origin Story
The idea for this project was born during a class where we interviewed ornithologists at ASU Poly Campus, leading to individual solutions for their needs.
My initial dashboard concept evolved into "Jerry, the Jr Research Aide," fully realized long after the class ended when I revisited this idea with a classmate and former colleague, Chidrupa.
PS: The name Jerry the Jr Research Aide, came when we repeated "Jr Researcher" words over and over, cause that's what this software was meant to do 😂.


Initial Research and Framing Problem
1
Project Genesis
Our journey began where academia meets real-world research. During a cross-disciplinary project and a stint in ASU's Psychology Department, we uncovered a widespread challenge—managing studies efficiently.
2
Challenges Identified
From psychology to educational technology, researchers faced issues with scattered data, resource chaos, and complexities in study coordination. This spurred the creation of "Jerry The - Junior Research AIde".
3
Solution and Vision
Jerry was envisioned as an all-in-one digital hub to simplify research across various fields. Its design focuses on user-friendliness and practicality, allowing researchers to seamlessly integrate materials, participants, and tasks.
4
Ultimate Goal
Our aim with Jerry is to provide a powerful yet straightforward tool that enhances data collection, collaboration, and participant management, ushering in a new era of streamlined and effective research management.
Understanding Existing Softwares
In a market brimming with solutions addressing our problem statement in various ways, we've selected these three products based on their popularity, robust feature sets, seamless integrations, and potential impact.

Planning the Project - Jerry
Initially, we aimed to complete the entire application design at once. However, we soon realized the enormity of the task, including user flows, features, edge cases, and functions.
As a solution, we divided the project into manageable phases to tackle one step at a time.
Phase 1
UX and UI Framework
UX & UI framework, Design System, Interface to facilitate Collaboration, Scheduling a Research study.
July 22 to Aug 22, 2023
Phase 2
Conducting the Research Study
To create a platform to conduct the test in-app.
SHELVED
Phase 3
Recording the Study results
To create a space where the metrics can be recorded with minimal effort
SHELVED
Phase 4
Visualizing the Study results
To analyze and understand the results through Data Visualization
SHELVED
Jerry - Phase 1
Problem - Planning a Research study
Listing Application Features
A crucial list for the project's success in creating a detailed information architecture in the future was the need to define the features and functions to incorporate.
On-Boarding New User
Creating a study
Adding Research Materials
Adding Collaborators
Assigning Roles and Permissions to Collaborators
Adding Participants
Creating Participant Groups
Creating Test Flows
Scheduling the Tests
Information Architecture
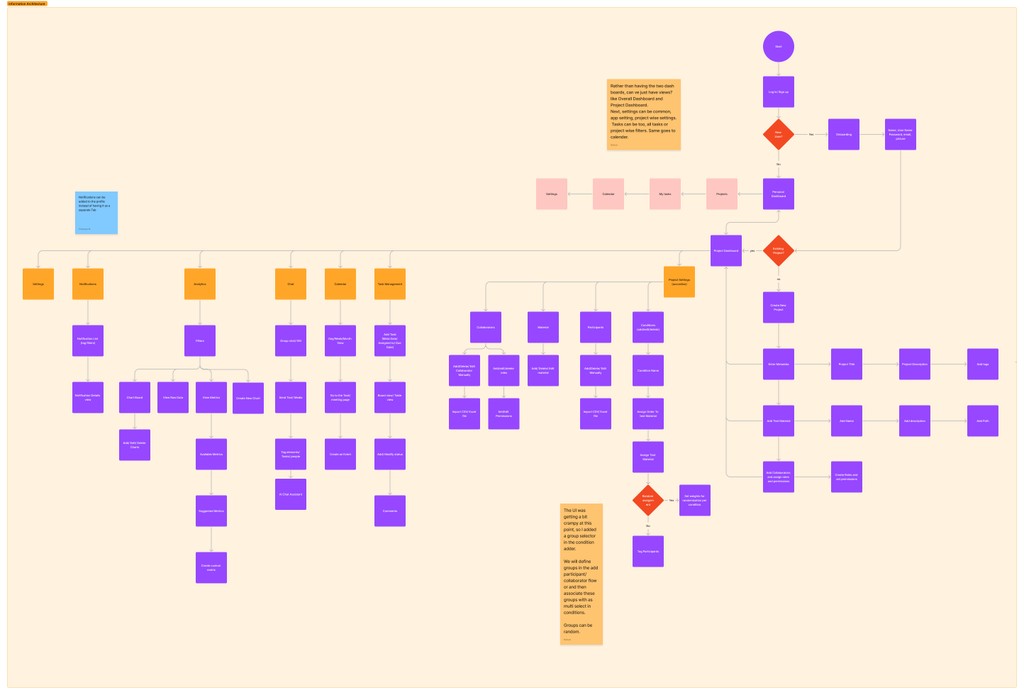
click on the image to open in high resolution.
3. Design System
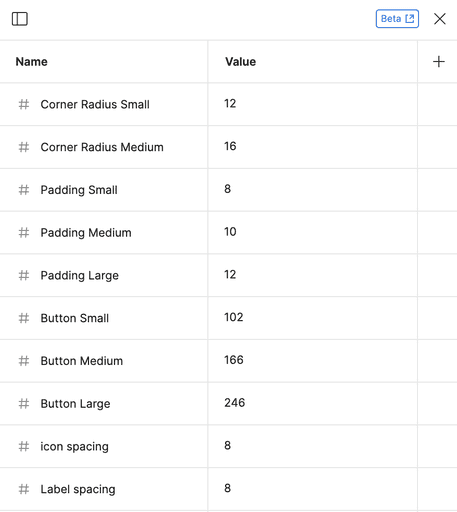
Integrated seamlessly into our project, Google's Material Design 3 color and typography systems serve a dual role. Rooted in extensive research and immaculately documented, these systems optimize visual appeal and inclusivity. The color system harmonizes aesthetics with accessibility, while the typography system ensures readability and consistency for diverse users. This integration elevates our interface, embodying our dedication to superior design.
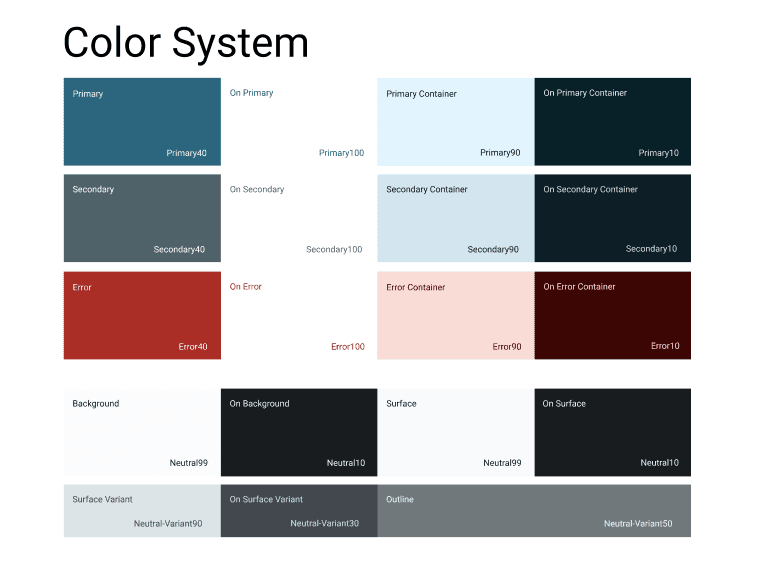
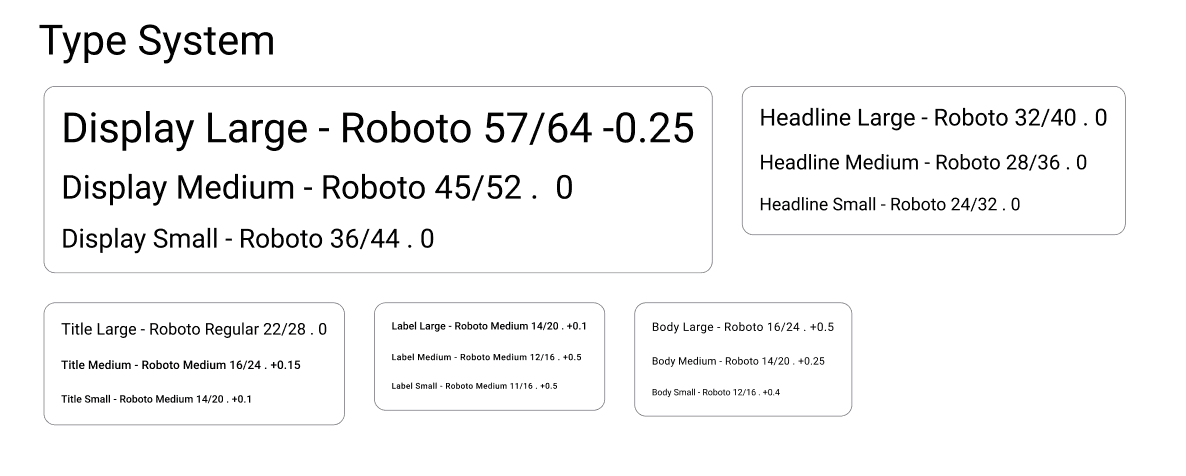
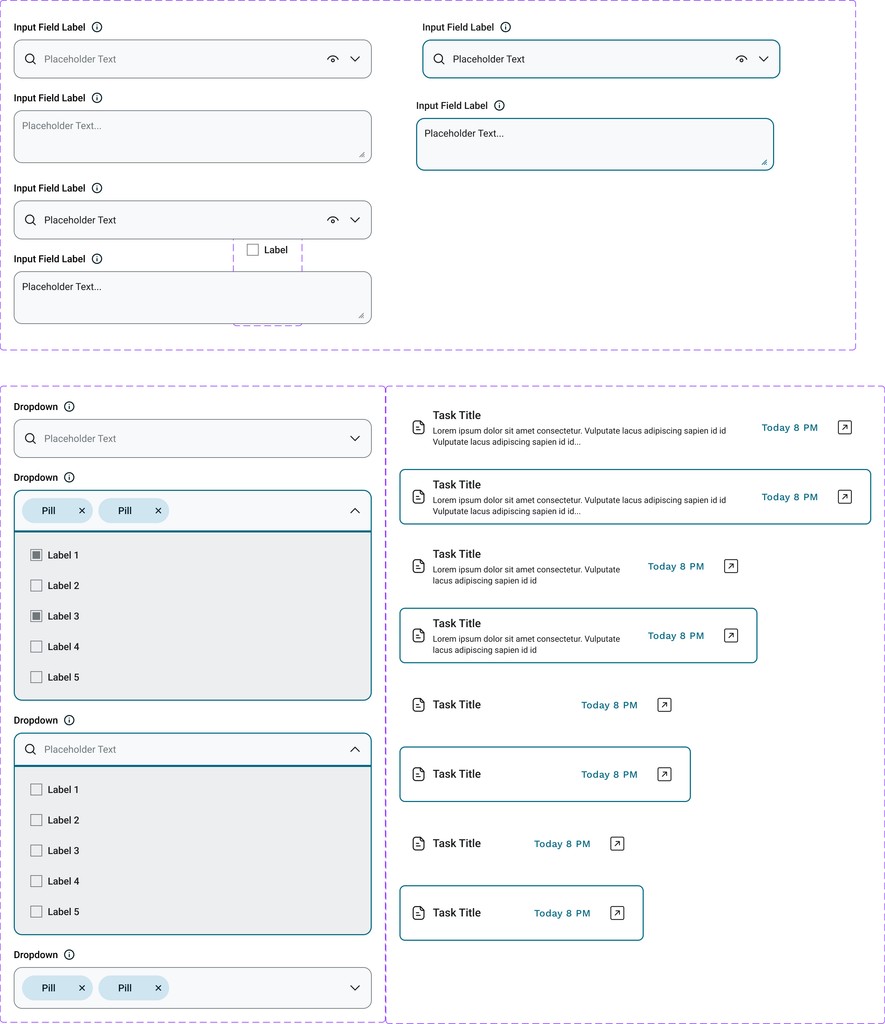
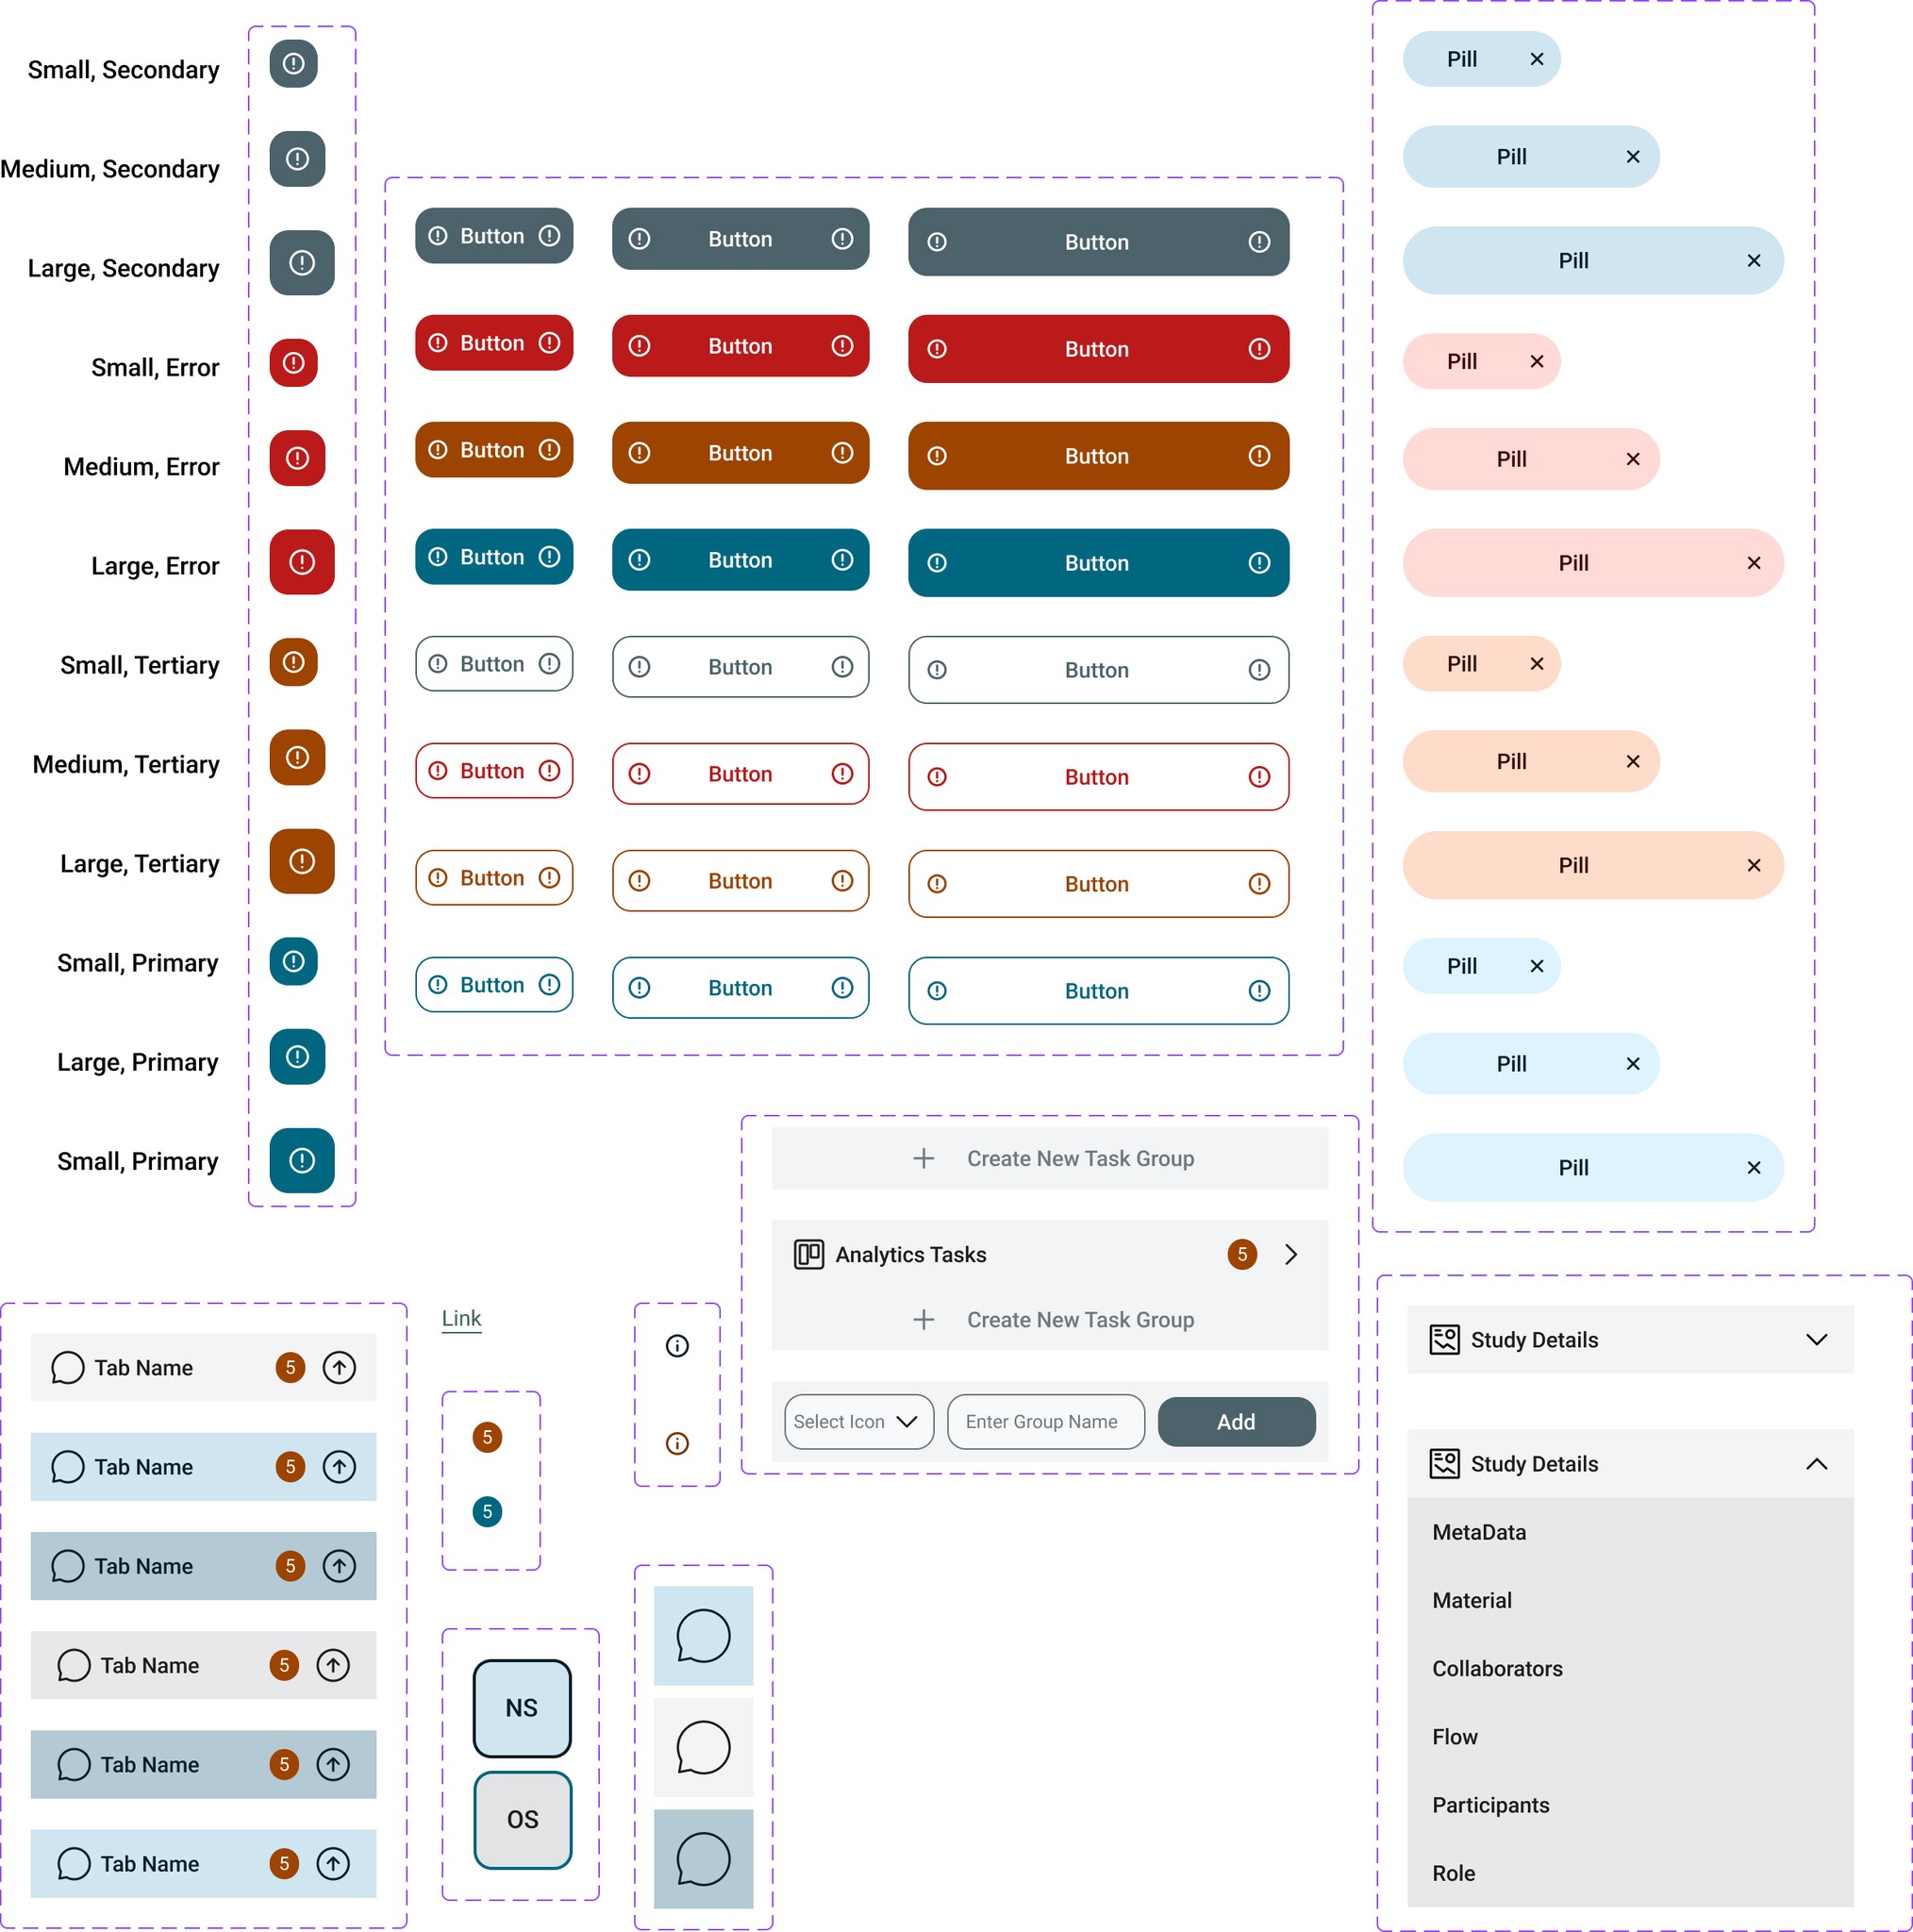
Moreover, we utilized the color and type system to establish a component library, facilitating swift prototyping and ensuring uniformity throughout the wireframes. To further uphold consistency, we harnessed Figma Variables.
UI Wireframes
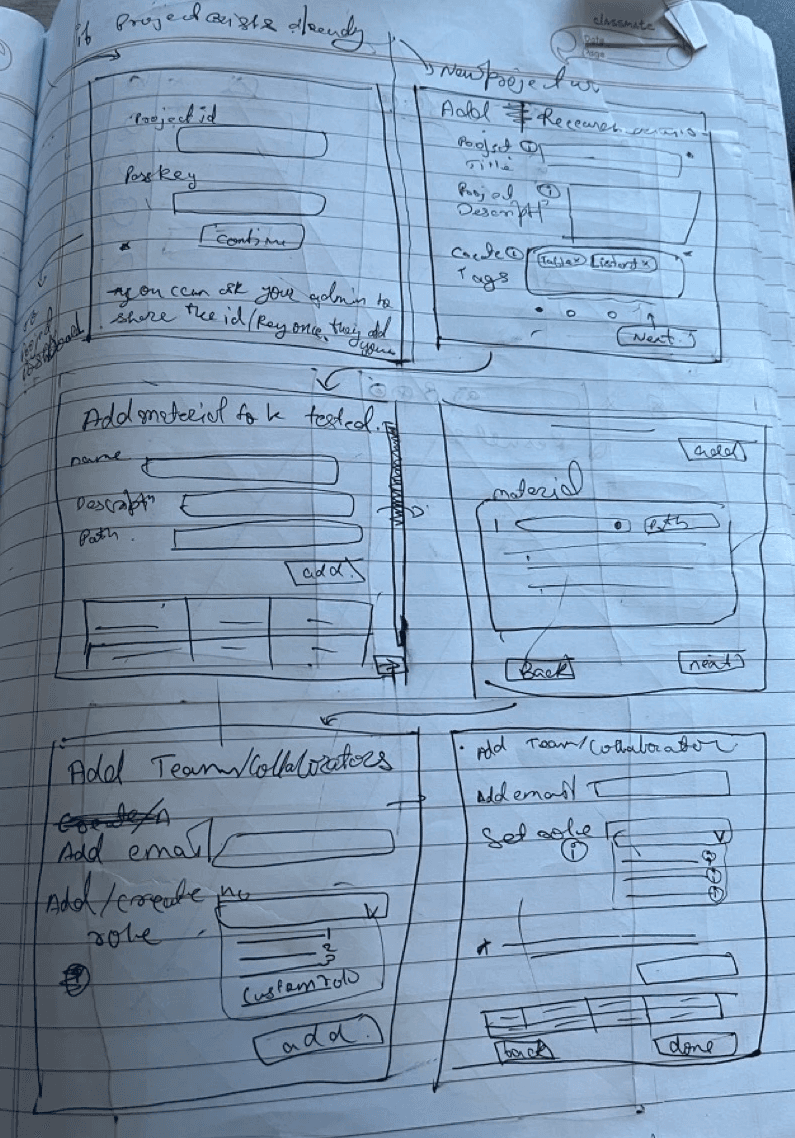
Initial Sketches
Individually, we started with old-school pen and paper sketches.
On the right side, you see the initial wireframes for login, new study creation, adding material, etc.
Following these sketches, we created individual user flows and their respective interfaces.
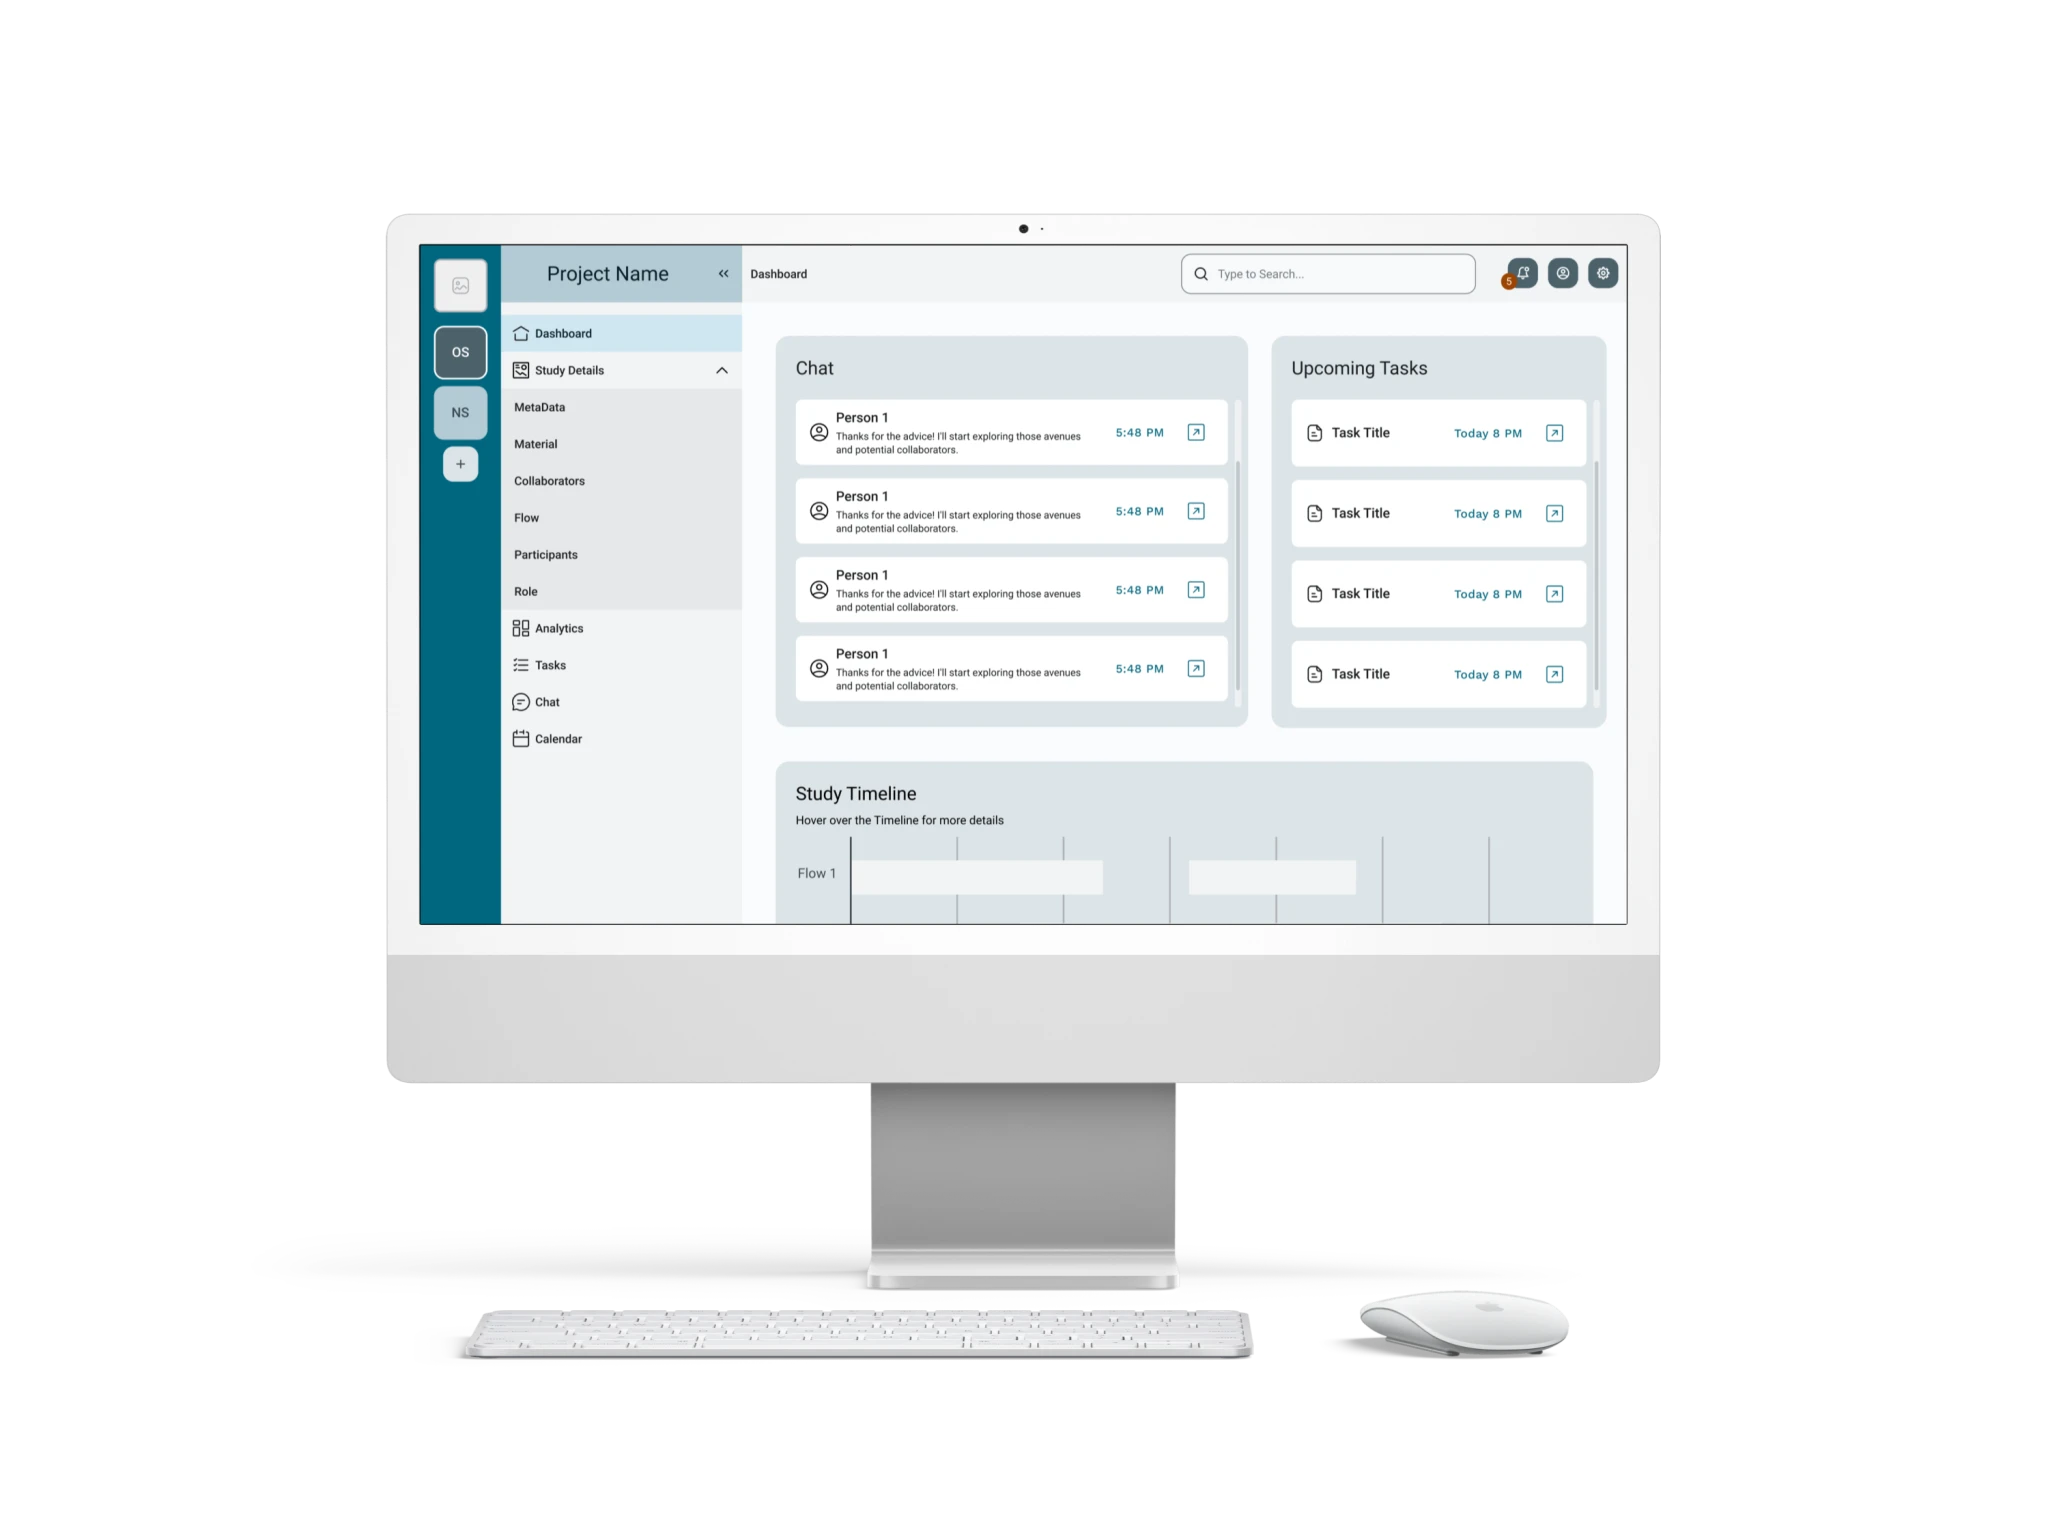
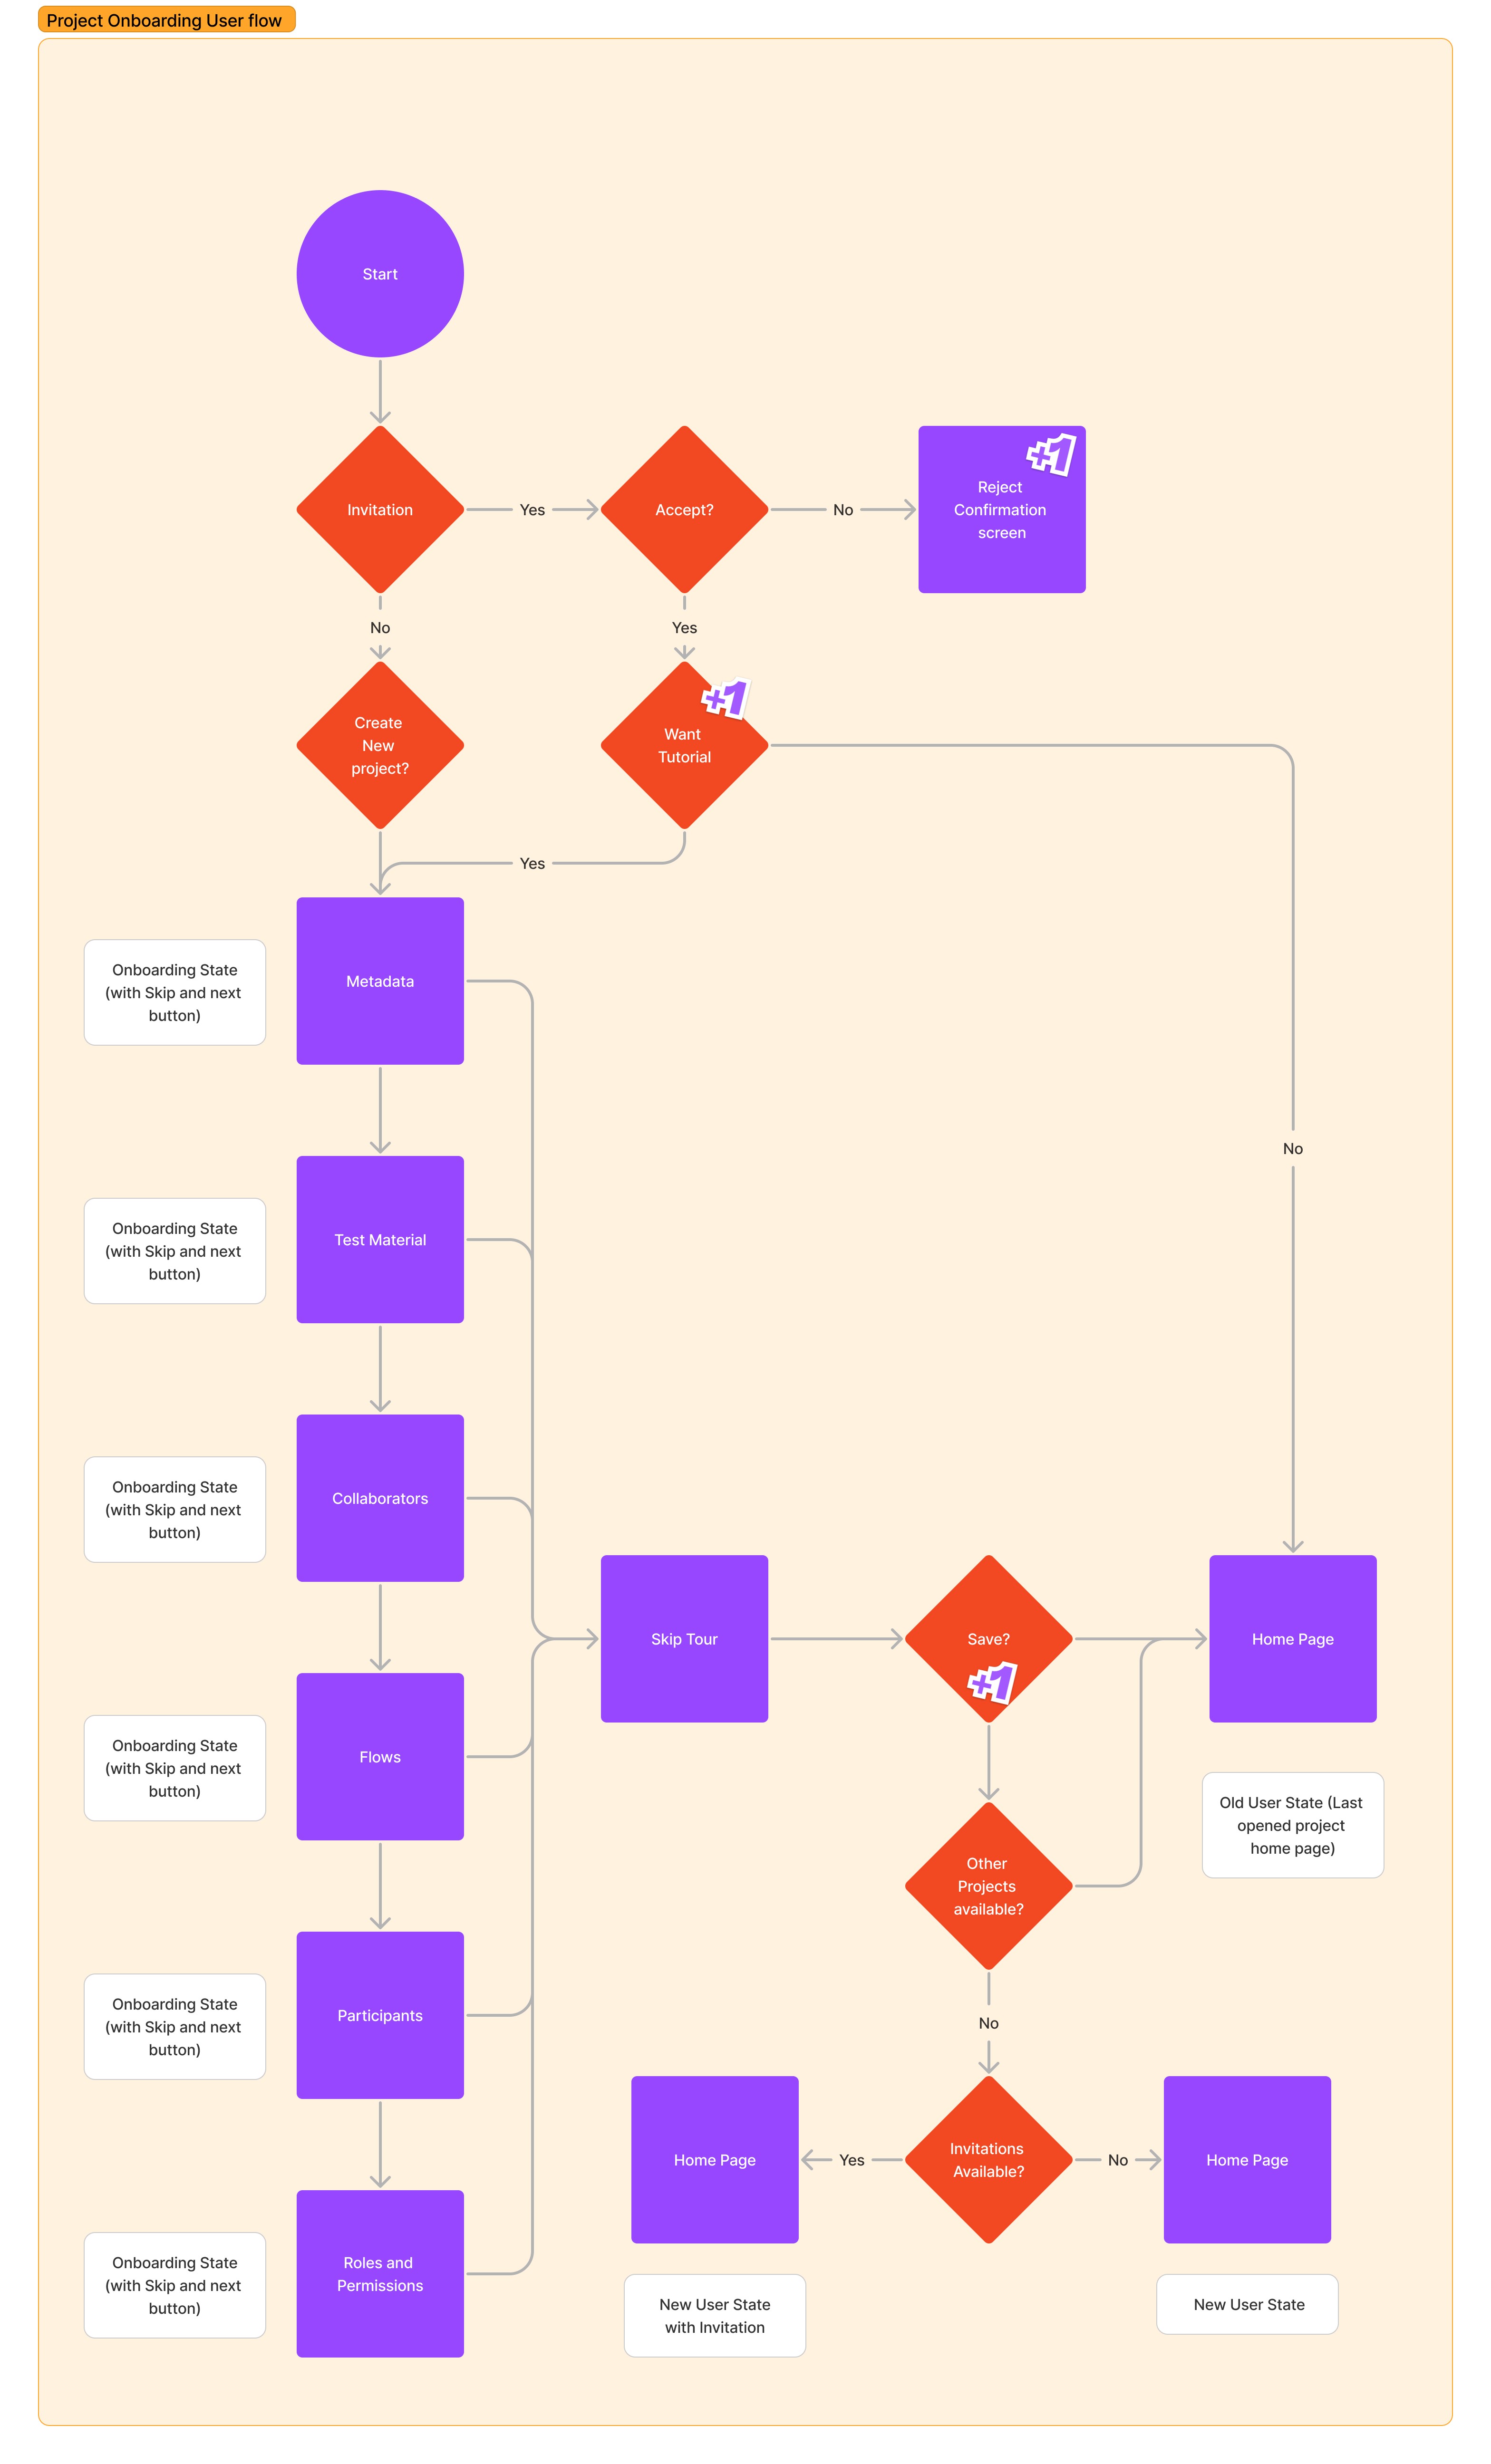
1. Onboarding and Dashboard
We aimed to create an interactive dashboard on the homepage, providing users with seamless project navigation and access to diverse features. This hub also showcases real-time chat updates, upcoming tasks, and an intuitive study timeline, enabling efficient task management. New users will follow an onboarding flow demonstrated in the video.
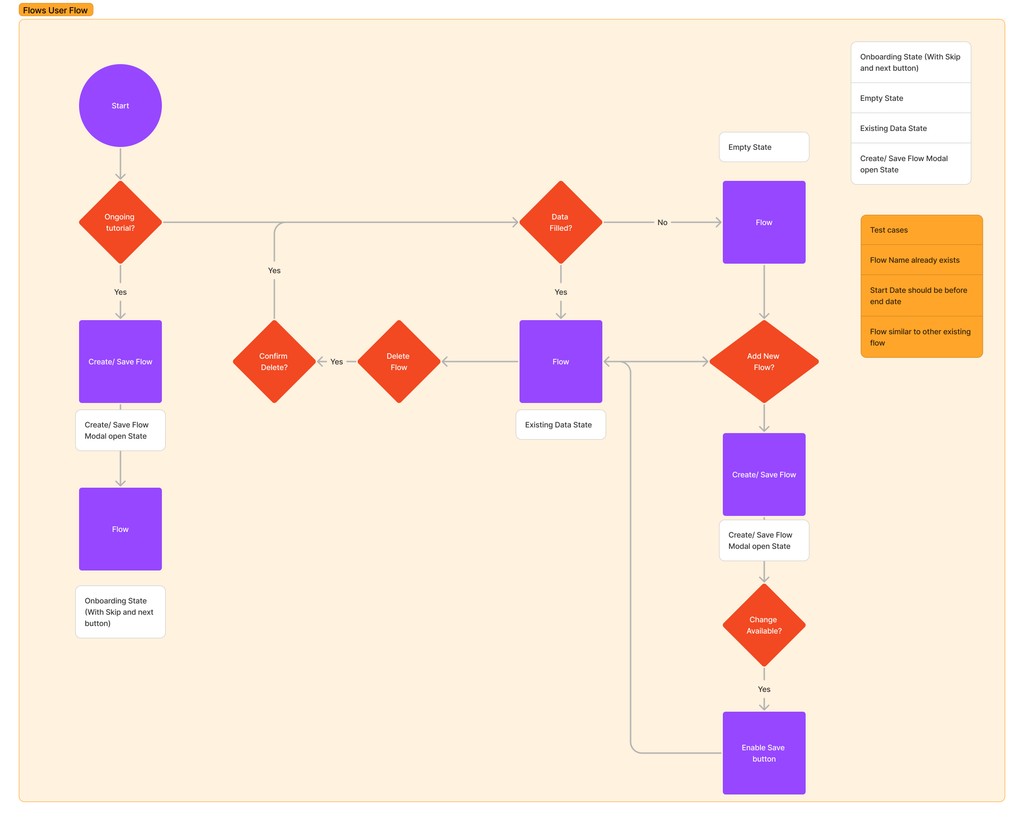
Flow
In research studies, to prevent biases, we've introduced a feature allowing researchers to create and customize test sequences. These sequences can be assigned to collaborators or specific participants/groups, with the flexibility to adjust the test phase order. Researchers can also schedule the duration of each sequence, and this information is added to the timeline for tracking study progress.

Groups and Participants
Recruiting and managing study participants can be a time-consuming task. To streamline this process, we offer a user-friendly feature that allows users to bulk import participants through simple Excel or CSV file uploads. These uploaded files are automatically transformed into easily editable tables.
Furthermore, efficiently dividing participants into groups and managing group sizes can be challenging. To address this, our platform provides an automated grouping system based on input from researchers. Users can also opt for manual group creation and management, ensuring flexibility, especially when dealing with extensive participant datasets.
Task Management
Frequently, users find themselves navigating external software such as JIRA and GitHub to effectively track tasks and address issues. In response, we've developed an integrated solution in the form of an in-app Task Management Board. This innovative board serves as a centralized hub, allowing users to oversee task advancement and manage issues directly within our platform.
Through this board, users gain the ability to not only monitor progress but also engage in seamless collaboration. They can offer comments, share insights, and exchange notes—all conveniently within the same interface. Furthermore, the option to flag critical elements and modify task statuses is readily accessible. By providing these comprehensive functionalities, we've streamlined task management, eliminated the need for external tools, and fostered an environment that nurtures efficient teamwork.

Conclusion and Learnings
In this project, I grasped collaboration dynamics, effort estimation, and honed skills in Figma variables, advanced prototyping, and design documentation.
Key Skills Acquired:
Collaborative design team dynamics
Efficient effort estimation
Figma variables and advanced prototyping
Effective design decision documentation
Adapting to key requirements molded our information architecture, facilitating project scope expansion. A developer's viewpoint revealed blockers, prompting a broader scope exploration.
Next Steps:
I am currently on other projects, but fof this one, future focus includes:
Design Evolution:
Interface design for diverse applications.
UX/UI for complex data and statistics handling.
Conclusion:
These experiences mark not just project milestones but personal growth. The journey continues with an eagerness to apply these lessons to future endeavors, contributing to both project success and ongoing professional development.